How to generate reports from a Shiny app
We often create Shiny apps to help clients to explore and visualise their data. Even when the eventual product will be a more formal report, exploring data interactively can help you notice interesting patterns and inform analysis. While Shiny apps are great for this, sometimes it’s also useful to be able to save results to look at later or to share with others.
Fortunately, it’s possible to generate reports directly from a Shiny app by using parameterised R Markdown (Rmd) reports. This means you can easily generate reports based on the selections made in a Shiny app and allows you to easily explore and share the data.
In this post, I’ll explain how to generate downloadable reports from your Shiny app. I’ll demonstrate how this works with an example app that uses a dataset on volcanoes from the Smithsonian Institution (you can download the dataset here).
An example app with a downloadable report

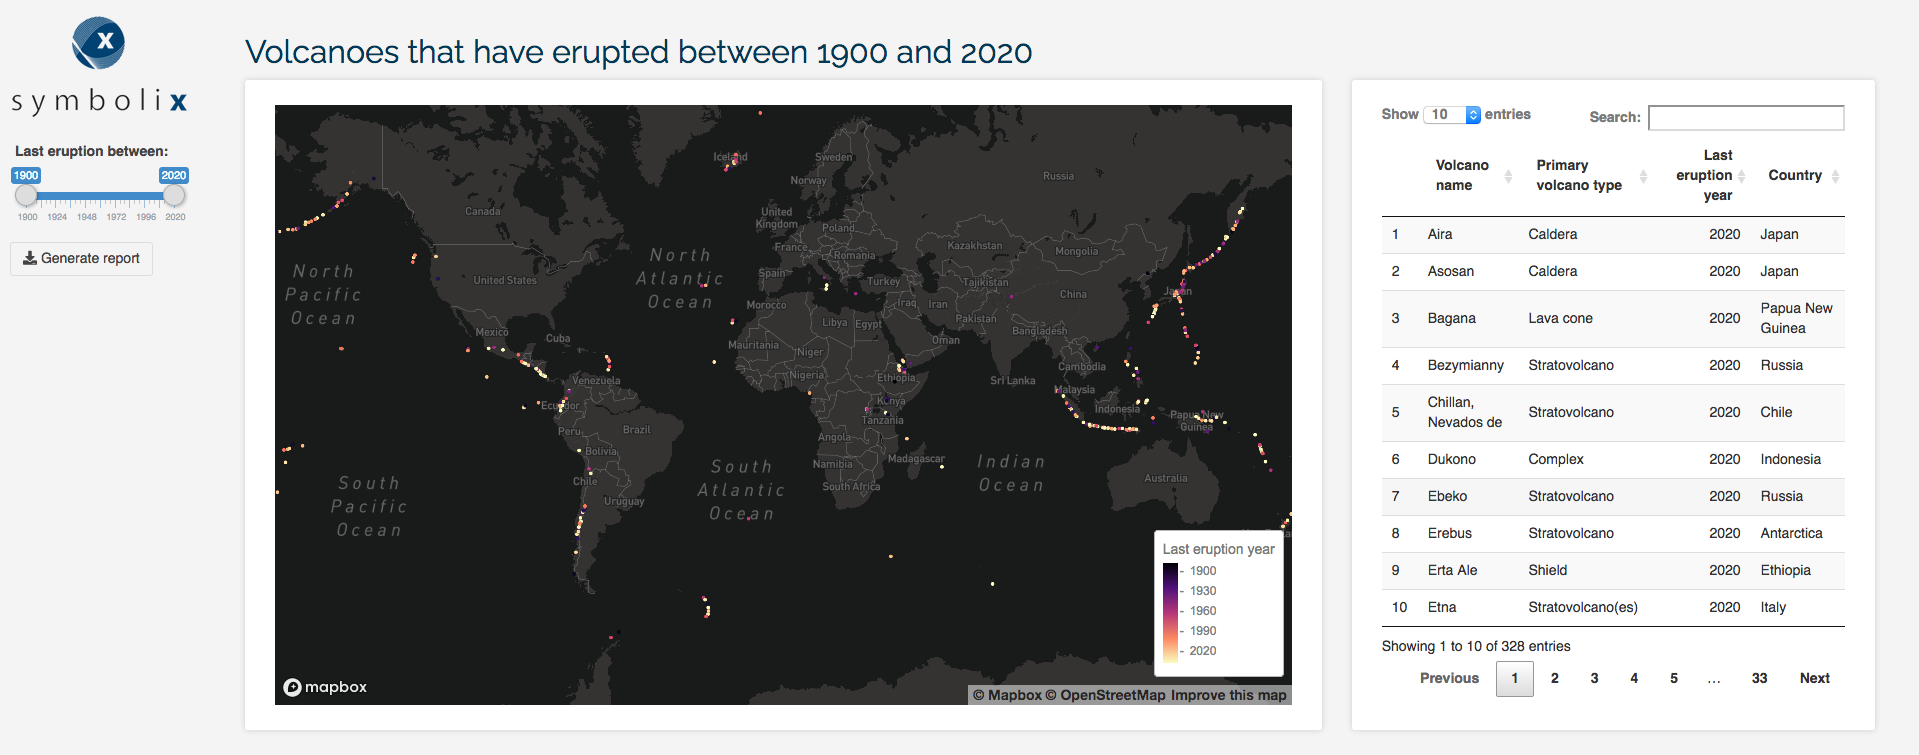
A Shiny app examining volcanoes that have erupted since 1900
The app allows you to filter volcanoes based on when they most recently erupted. You use a slider to select a range of years you would like to see data for. The initial values are 1900-2020, but changing these will update the interactive map and table to show you only volcanoes that have last erupted within the selected timeframe.
Clicking the “Generate report” button in the side panel will generate an HTML document that contains the map and table from the Shiny app as well as some additional elements. This HTML document could easily be saved and shared with others.

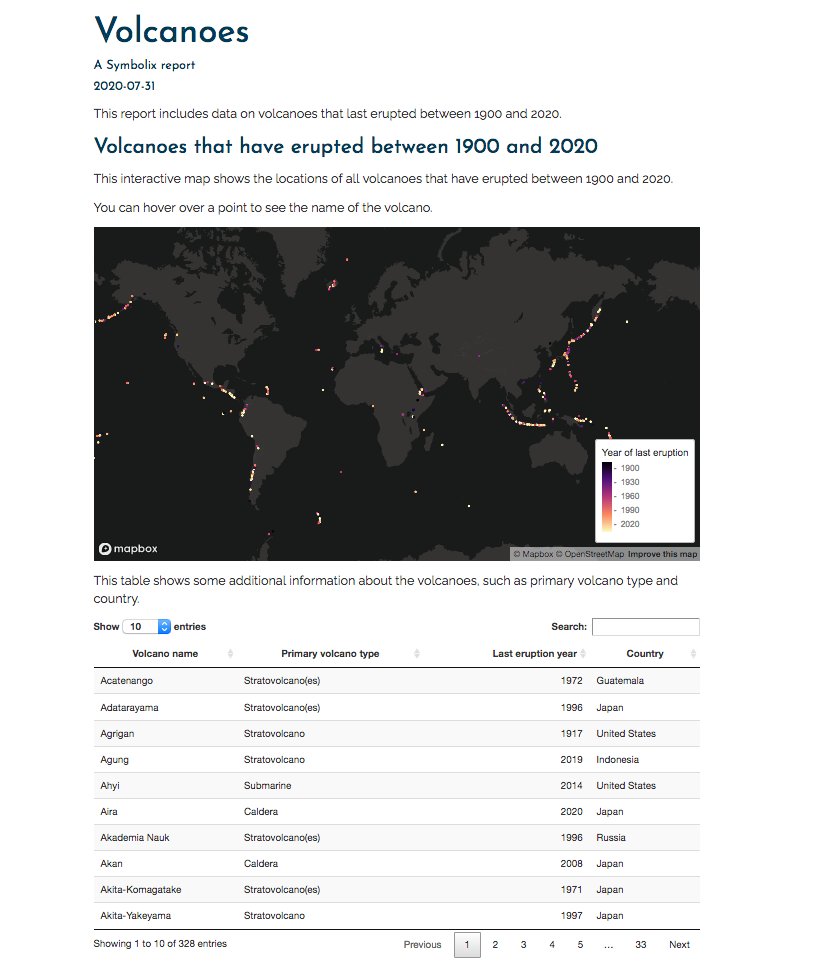
HTML report generated from the Shiny app
Importantly, the map and table are interactive in the HTML report in the same way as they are in the Shiny. You can zoom in and out of the map and search the table.
Step one: Set up an R markdown file with parameters
Creating an Rmd that can be knit from a Shiny is straightforward. The key to creating downloadable reports is the params field in the YAML header of your Rmd. This allows you to declare parameter values that are used in the file.
The params field is the link between the Shiny app and the Rmd file. You can pass values and even objects from the current Shiny session to the Rmd, and these will override whatever is set in the YAML header.
Here is the YAML header for the volcanoes report I showed above:
---
title: "Volcanoes report"
author:
  - name: A Symbolix report
    url: https://symbolix.com.au
date: "2020-10-29"
output: html_document
params:
    si_year: !r c(1900, 2020)
    dt_volcano: NULL
---
The parameters you include here determine what you can pass from the Shiny to the Rmd. In this case, I want to be able to access the selected years (si_year) and the processed volcano dataset dt_volcano (filtered based on the year the user has selected) from the Shiny. The params can be easily accessed within the Rmd; for example, you can get the value for si_year using params$si_year. You can override whatever values that are set in the YAML header when you knit from the Shiny.
Because you can pass objects to your Rmd file, this means that any processing that occurs in the Shiny doesn’t need to be repeated when the Rmd is being knit. This can really speed things up when you’re accessing large amounts of data from a database or doing lengthy computations.
Step two: Use shiny::downloadHandler to allow an Rmd to be knit and downloaded from the app
To generate the report, we use the shiny::downloadHandler function. This RStudio article has a great explanation of how to do this. This is the relevant code in the server.R file for the volcano Shiny app:
output$report <- downloadHandler(
        filename <-  "volcanoes_report.html",
        content = function(file) {
            tempReport <- file.path(tempdir(), "volanoes_report.Rmd")
            file.copy("../volcanoes_report.Rmd", tempReport, overwrite = TRUE)
            params <- list(si_year = input$si_year,
                           dt_volcano = rv_volcano())
            rmarkdown::render(tempReport, output_file = file,
                              params = params,
                              envir = new.env(parent = globalenv())
            )
        }
    )
volcanoes_report.Rmd is the Rmd file that we want to knit to generate the report and volcanoes_report.html is the name of the HTML file that will be output. In the call to rmarkdown::render, we specify the parameters that should be used in volcanoes_report.Rmd. Remember, these values will override whatever is in the YAML header. The value for year range selected comes from the Shiny app’s slider input (input$si_year) and dt_volcano is the volcano dataset that has been filtered based on the year range selected. This filtering is performed in the Shiny using a reactive expression (rv_volcano()).
Now the server.R part is set up, you will also need to add a download button to the Shiny that when pressed will lead to the Rmd file being knit. I added this to the ui.R file:
downloadButton(
      outputId = "report",
      label = "Generate report"
    )
How do I generate a PDF instead of an HTML file?
In this case the report we are generating an HTML file, but you can also produce a PDF or even as a Word file. This requires changing the filename extension when you call downloadHandler and changing the output in the YAML header of the Rmd (see this article for more detail).
Bear in mind that in a PDF any interactive elements will be displayed as static images. So, HTML is the best choice if your report has interactive elements like maps you can zoom in on or clickable tables.
What if I want the option to generate a report either directly from the Rmd file or from a Shiny app?
The current set up allows you to run a report from a Shiny app, but you may also want to be able to knit the Rmd without launching the Shiny. This won’t work at the moment with the example app because several elements in the report require the dt_volcano object and this is set to NULL in the YAML header. We need a way to be able to load and filter the volcanoes dataset when the report is being knit directly but to otherwise use the object from the Shiny.
I handled this by adding a chunk to the Rmd that downloads and processes the volcanoes dataset only if params$dt_volcano is NULL (that is, if the report is being knit directly from the Rmd file). In this case, the si_year values from the YAML header will be used.
if (is.null(params$dt_volcano)) {
  FP <- paste0("https://raw.githubusercontent.com/rfordatascience/",
               "tidytuesday/master/data/2020/2020-05-12/volcano.csv")
  dt_volcano <- data.table::fread(FP)
  dt_volcano[,
             last_eruption_year := ifelse(last_eruption_year == "Unknown",
                                          NA,
                                          as.integer(last_eruption_year))]
  dt_volcano <- dt_volcano[last_eruption_year %between% params$si_year]
  }